

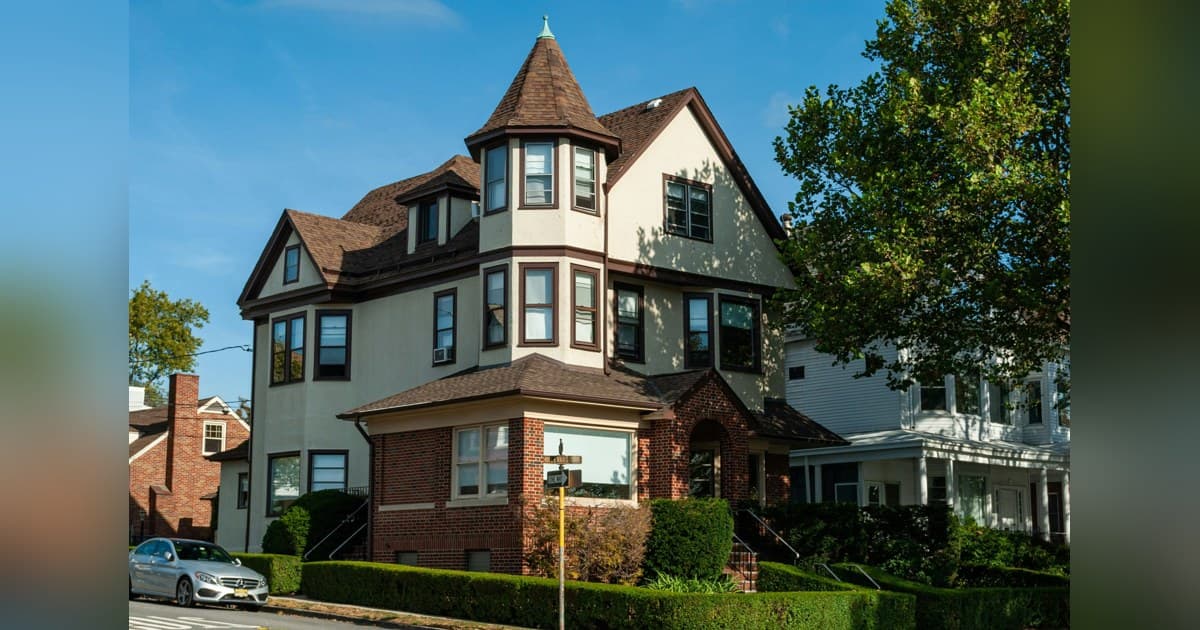
As the real estate market passes its midpoint, weekly data tracked by Mark Slade Homes reveals that Maplewood, NJ, and its sister town South Orange, NJ, continue to see prices and demand well ahead of last year, according to the latest snapshot for the week ending August 23. The analysis, based on Mark Slade's proprietary 'hyper market index,' compares homes under contract to active listings, providing a real-time view of buyer activity that differs from traditional absorption rates.
Montclair holds the strongest position among the seven towns tracked, with 191 homes sold so far, an average sale price of $1,512,172, and 22.5 percent over asking. Homes there average just 17.4 days on market, and its hyper market index ratio stands at 1.9, the highest in the group. Maplewood follows with 137 solds, an average price of $1,304,556, and 16.4 percent over asking, with the fastest pace of any town at 13.6 days on market. Its ratio sits at 1.2. South Orange is close behind with 86 solds, averaging $1,230,401 and 15.8 percent over asking, and a ratio of 1.6, ahead of Maplewood on that measure.
West Orange has posted 239 solds with an average price of $768,749, running 10.6 percent over asking and about 20.6 days on market, with a ratio of 1.2. Union has 198 solds at $602,239, trending 4.2 percent over asking with a ratio at 1.0. Livingston remains the softest of the core markets, with 156 solds, an average price of $1,399,451, and only 3.2 percent over asking. Its ratio of 0.7 indicates more active listings than homes under contract, and days on market run about 20.2. Rahway, the newest addition, is softer still at 1.2 percent over asking, 30.2 days on market, and a ratio of 0.3.
Year to date, Maplewood has closed 156 sales, with 137 from listings taken this year, indicating little carryover inventory is dragging on the numbers. Livingston shows the opposite pattern, with a larger share of its 204 year-to-date closings tied to older listings, which helps explain its lagging pricing power. Another factor is the number of exclusive listings—homes sold without full open market exposure—which in Livingston made up 10.8 percent of closings, well above the 2 to 6 percent seen in other towns.
Across the board, 2026 is outperforming 2025. Maplewood's closed sales represent 87.8 percent of its year-to-date total compared to last year, with meaningful gains in price and percentage over asking. South Orange is running at 84.9 percent of last year's pace with similar gains. West Orange and Montclair are trending strong at 80.5 percent and 88.4 percent respectively, while Livingston, at 76.5 percent, remains the slowest-moving market.
For business leaders and industry observers, these figures offer a snapshot of regional economic health and consumer confidence. The strength in towns like Montclair and Maplewood suggests robust demand and pricing power, which could have implications for local businesses, construction, and financial services. Conversely, Livingston's softer data may signal a more balanced market, potentially affecting investment decisions and inventory strategies.
Slade advises sellers considering a fall listing to wait until the week after Labor Day, as listing during that week competes with back-to-school distractions, historically yielding weaker results. This insight could influence timing decisions for sellers and investors looking to capitalize on market conditions. For ongoing updates, readers can check the blog for continuous market coverage.
